Kennerly, Richard. QEEG Analysis of Cranial Electrotherapy: A Pilot Study. Journal of Neurotherapy. 2004; (8)2. Presented at the International Society for Neuronal Regulation annual conference, September 18-21, 2003 in Houston, Texas. Download Article
Introduction
Cranial electrotherapy stimulation (CES) is the use of low level electrical current applied to the head for therapeutic purposes. Cranial electrotherapy stimulation is also known as electrosleep, cranial electrotherapy (CET), cranial stimulation (CS), transcranial electrotherapy (TCET), neuroelectric therapy (NET), cranial TENS and auricular electrical stimulation. The FDA authorizes the production and sale of medical devices for cranial electrotherapy in the United States for the treatment of depression, anxiety, and sleep disorders. To date 112 of 126 published studies in the US on CES have had positive outcomes, involving 4,541subjects (in all 126 studies) without significant side effects from the treatment (Kirsch, 2002). The current study was conducted to determine the effect of cranial electrotherapy on cortical activity as measured by QEEG before and after a single 20-minute use of CES. This pilot study is being followed up by a double blind placebo controlled study of cortical activation changes from baseline with three and six weeks of CES treatment.
University of North Texas Neurotherapy Lab
Method
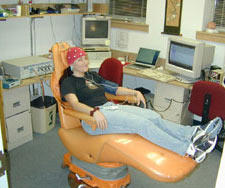
Digital EEG for QEEG analysis was obtained from 30 research volunteers using a Neurodata-24 digital EEG system. CES was providing with Alpha-Stim® 100 cranial electrotherapy units set to .5 hertz. QEEG data was processed and analyzed with the NeuroGuide system. Statistical analysis of the data was conducted with the NeuroGuide, SPSS and JMP statistical packages. Digital EEG, blood pressure, heart rate, electrodermal activity and finger temperature was acquired during a baseline condition, during cranial electrotherapy, immediately after electrotherapy, and after three weeks of daily use of cranial electrotherapy.
Results
During CES at 0.5 Hz significant increases were seen across the entire cortex in delta and gamma frequencies, this effect was uniform for all volunteers. After a single 20-minute session of CES decreases were seen in delta and theta frequency activity with concomitant significant increase in alpha activity. The study volunteers generally reported feeling more relaxed after 20-minutes of CES. Some volunteers reported feeling as if their head had cleared and they felt more awake. Research volunteers who reported pain or anxiety before the single session of CES treatment reported significant reductions in pain and anxiety after the 20-minute treatment.
Conclusions
This pilot study indicates that CES at 0.5 Hz entrains delta and gamma frequencies during active stimulation. After a single 20-minute treatment with CES there is a significant increase in alpha frequency activity and a significant decrease in delta and theta activity. The post treatment maps indicate the effect of single session cranial electrotherapy treatment on QEEG is congruent with the reports of the research volunteers of decreased anxiety and increased relaxation.
References
Kirsch, D. L. (2002). The Science Behind Cranial Electrotherapy Stimulation. Edmonton, Alberta: Medical Scope Publishing Corporation.
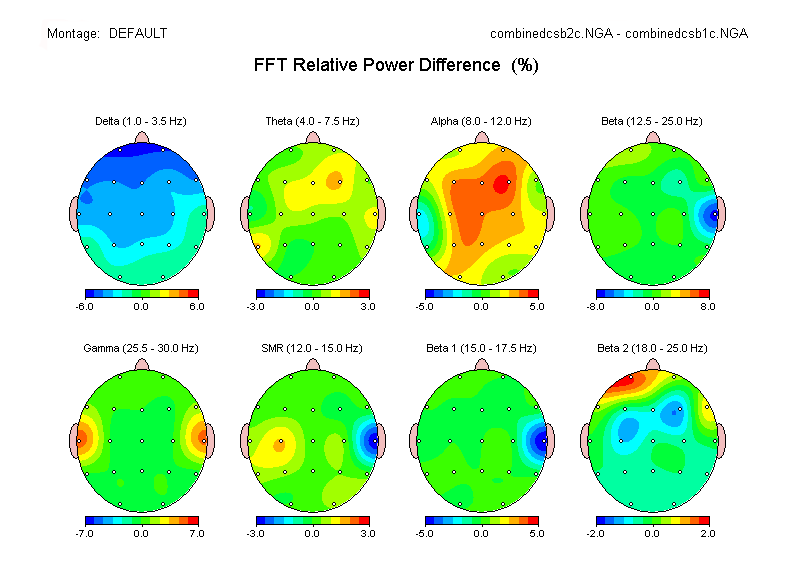
The above is a quantitative EEG brain map (QEEG) showing the changes in brain activity by traditional EEG bands of 30 volunteers after a 20 minute treatment with Alpha-Stim® CES at 0.5 Hz. Blue shows a decrease in activity after Alpha-Stim® while red shows an increase in activity. There is an increase in alpha activity (relaxation brain waves) with a simultaneous decrease in delta activity (sleep brain waves) after using Alpha-Stim® for 20 minutes. The changes near the ears were found on raw EEG to be artifact.
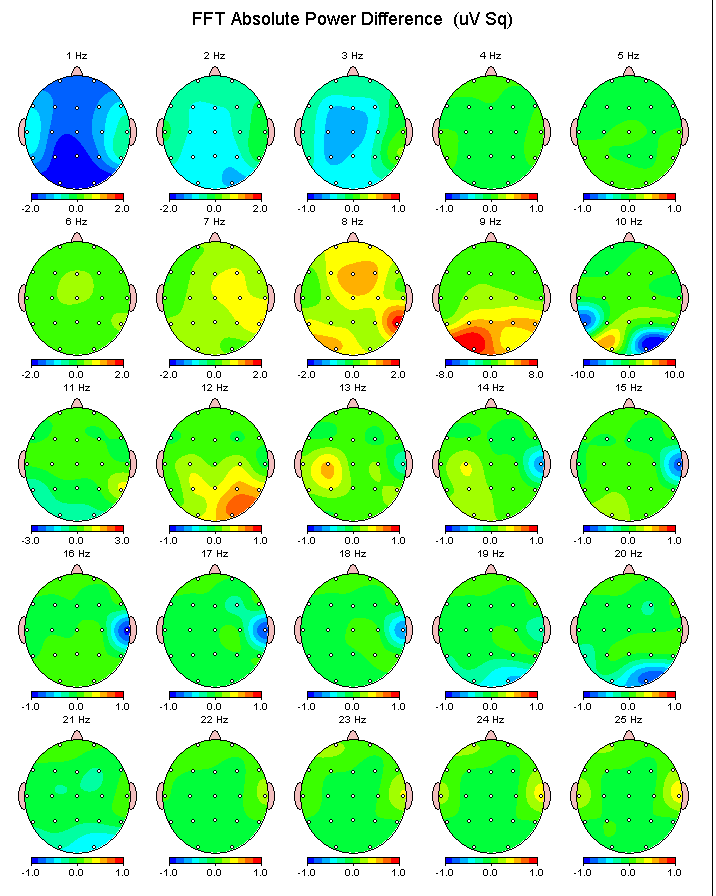
The above is a representation of the electrical activity of the brain by frequency after 20 minutes of use of Alpha-Stim® CES at 0.5 Hz. The EEG of 30 research volunteers was averaged and analyzed by computer to generate the average of brain changes in brain activity after 20 minutes of Alpha-Stim®. This is a difference brain map, where a decrease in activity after the use of Alpha-Stim® is shown in shades of blue and an increase in activity is seen in shades of yellow and red (green indicates no change). The above map shows that there is a decrease in delta, the 1, 2, and 3 Hz frequencies associated in waking individuals with impaired cognitive functioning. Significant increases are seen in alpha frequencies with peak activity at 9 Hz. Increases were also seen in activity at 12, 13 and 14 Hz, with 13 and 14 Hz activity centering on C3.
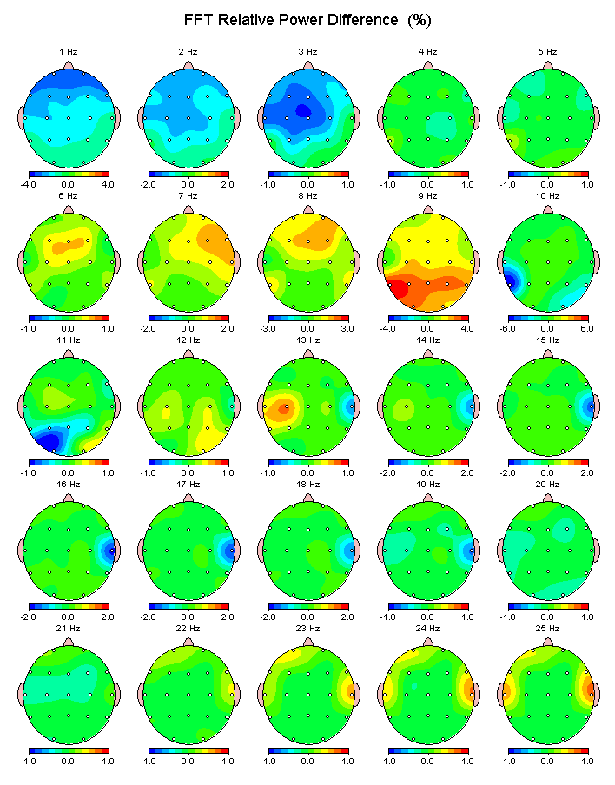
The above map is a relative power map, which is a percentage map showing activity in the brain at each frequency as a percentage of 100% (all activity of the brain). The activity changes represented by the relative power map show the same general pattern of decreases in slow waves associated with sleep and increases in alpha and SMR frequencies, which are associated with relaxation.